
GrammaTech CodeSonar is primarily a static analysis tool, but there are some circumstances where it is useful to present dynamic information alongside static results. For example, having information about how often a procedure is called may help you judge whether a leak report is worrisome or harmless; a 1kb leak in a part of the program that is executed only once is much less serious than a leak that occurs in code that is executed a lot. Similarly, information about code coverage can help you decide how to triage a warning within uncovered code.
In this series of three blogs, I describe how it is easy to bring dynamic information into the CodeSonar static analysis world. I will cover these topics:
- How to show time profile information in CodeSonar
- How to import code coverage information, and
- How to show the results of dynamic memory-analysis tools.
Metrics in CodeSonar
CodeSonar computes various code-level metrics such as lines of code counts and McCabe cyclomatic complexity metrics. These are associated with procedures, files and the entire project. It is also possible to use the extension API to write custom metrics.
A profiling tool such as gprof (there are many others, but this one is very widely available) computes information about procedures including
- The number of calls to a function
- The time spent in the function itself
- The time spent in the function and everything it calls transitively
To use gprof, you compile your program with the –pg flag, then execute it with your test cases. This causes a special file to be created, that can be turned into human-readable form with a command line as follows:
gprof -b -L -p --inline-file-names bc >gprof.txt
This writes the profiling information to the file gprof.txt. The first few lines of an example run are shown below. Note that the functions and the files in which they are found are identified by name.
Flat profile:Each sample counts as 0.01 seconds.% cumulative self self totaltime seconds seconds calls ms/call ms/call name18.75 0.09 0.09 3 30.01 160.04 execute (execute.c:67)18.75 0.18 0.09 1021353 0.00 0.00 bc_multiply (number.c:639)16.67 0.26 0.08 971853 0.00 0.00 bc_divide (number.c:742)
It is relatively easy to write a simple program that can convert this information into a comma-separated-value format file. A plug-in for CodeSonar is available that can then read that file and create metrics for each procedure. To get this to run, you can put it in your .conf file as follows:
PLUGINS += csvmet.py
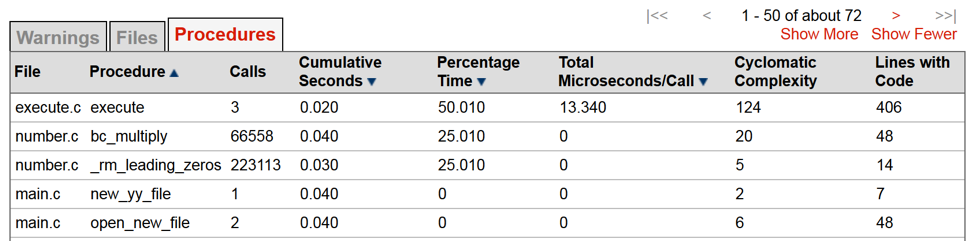
Once these metrics are in the CodeSonar database, they can be viewed in several ways. The simplest way to see them is alongside some of the built-in metrics as shown below.
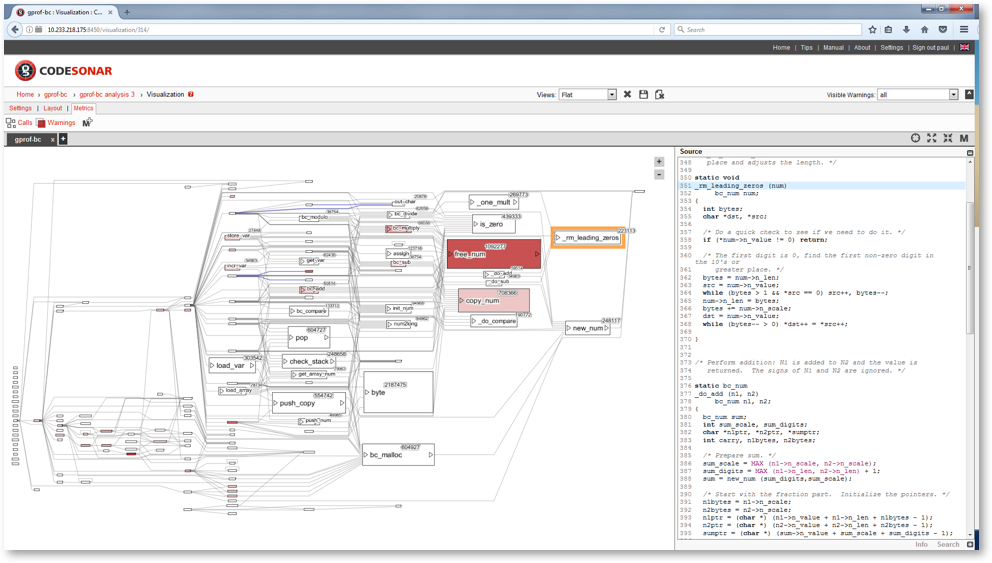
They can also be shown in the visualization tool. The figure below shows a screen capture of a visualization of the call graph. In this particular instance, the size of the rectangles is proportional to the percentage time spent in each function, and the intensity of the red is proportional to the number of static analysis warnings found in the item. From this, the user can easily pick out the places in the code that are both consuming most time during execution (the size of the box), as well as those that are potentially most risky (the intensity of the red). This will help the user focus on the parts of the program most likely to benefit from increased scrutiny. Selecting the box reveals a link that allows the user to see all of those static analysis warnings.
The CodeSonar plugin used is this example, named csvmet.py, is capable of importing arbitrary metrics, as long as they are in the expected format. This plugin is available below: