Our newest version of CodeSonar has a new program visualization feature: treemaps. CodeSonar has had call graph visualization since the last release, and it turned out to be fairly simple to implement treemaps because they use the same framework.
Treemaps offer an information-dense way of seeing properties of hierarchical structures. They were originally used as an easy way to see where space was being consumed in a file system, and since then they have been used in many different applications. Wikipedia offers a good description.
The key property of treemaps is that the size of the node can be used to indicate the size of the item it represents. Color can also be used to show a different property of the item.
The default treemap in CodeSonar uses the size of the node to indicate the number of lines of code in the item (function, file, directory), and the strength of the color indicates the number of CodeSonar warnings found within. Below is an example.
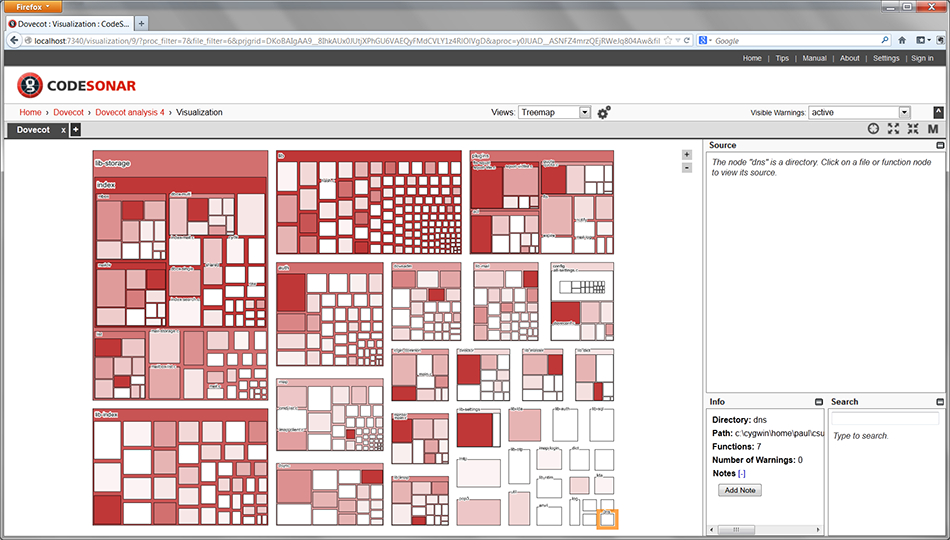
The above screenshot shows the treemap for a version of an open-source program named Dovecot, an email server. From the treemap, it is easy to pick out the largest modules, and at each level of the hierarchy, it is easy to see which components are responsible for the most warnings.
All the way at the bottom right is node that represents a directory named dns. I have selected this and, in the info pane in the right, you can see that it contains seven functions. You can’t see those functions because the view is far out, but if you zoom in, they start to show up.
Below you can see a zoomed-in view:
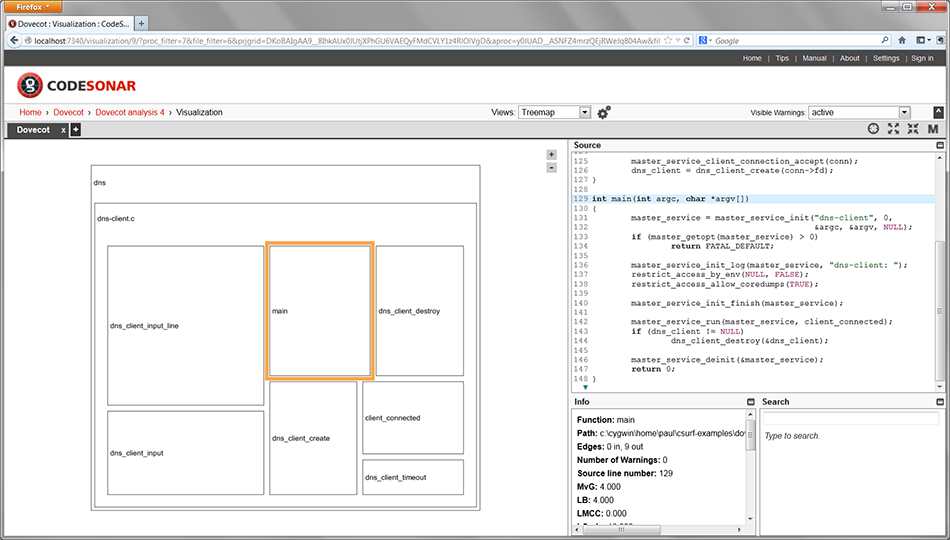
Panning around and zooming in and out of these treemaps can be mesmerizing, especially for large programs. You can zoom all the way in, to see a single module with just a few functions, and as you zoom out, it gives you a real sense of the magnitude of the program in relation to those functions.
Now, what makes this view especially interesting is that you can use any metric that CodeSonar generates to drive the view. Instead of using the color to represent the count of the number of warnings, you can have color represent some other numeric property of the code. For example, the color can represent cyclomatic complexity.
This got me wondering about what other metrics would be useful to see in the treemap view. I had been reading a paper by Pratyusa Manadhata and Jeannette Wing from CMU on metrics for measuring a program’s attack surface, so this seemed worth exploring. Security analysts talk about a program’s attack surface as the subset of the program that is exposed to a potential attacker, usually the set of places where it receives input on a potentially hostile channel. When doing a security analysis, it is often essential to know the attack surface, because those points are where the application is likely to be most vulnerable.
Now, the paper I mentioned above is very careful to lay out a nice definition of a metric in terms of sources of hostile input, channels along which data may flow, and sinks for that data. This was a bit too complicated to implement on a whim, so I decided on a much simpler definition of attack surface. For many applications, the attack surface can be thought of as the set of places where the program receives input. I settled on the definition of a metric as the number of locations in a function where it calls a C library function that gets input. Such functions include read, scanf, getenv, etc.
CodeSonar has an API that gives access to the entire program model that CodeSonar uses. Much of the model is exposed through a visitor pattern – you write a function to handle, say, a program point, and the internal mechanisms take care of calling the function on all eligible program points. The API handily allows you to define your own metrics too. Here is the code in Scheme that defines a new metric.
1 (codesonar: add-setup-visitor
2      '("Any")
3      (lambda ()
4          (codesonar:metric-create-class
5                  "Surface"
6                  "Function attack surface"
7                  'metric-granularity-procedure
8                  m:surface
9                  (list 'metric-flags-auto))
10      )
11  )
Don’t get put off by the Scheme syntax – it’s easier than it looks and the API is available in C also. For those who are not familiar with Scheme, let me explain. This is a call to the function codesonar:add-setup-visitor with two parameters. The first parameter on line 2 specifies the set of languages to which the visitor applies, and the second paramater (lines 3–10) is a lambda expression (i.e., a closure) that calls the function codesonar:metric-create-class. A setup visitor is one that is called at the beginning of the analysis before any of the traversals are active.
The function codesonar:metric-create-class will create a new metric named “Surface” (line 5) that works at the granularity of procedures (line 7). To compute it, CodeSonar will call the function m:surface (line 8) on all functions in the program, and the metric will be reported automatically (line 9). The internals take care of everything else.
The function that actually computes the metric is quite simple. Now clearly it needs to know which functions are input functions, so an earlier part of the script (not shown) creates a hash table (named m:table) that contains those names.
1 (define (m:surface pdg)
2      (let ((surface 0))
3          (for-each
4              (lambda (cs)
5                  (let ((callee (pdg-procedure-name (pdg-vertex-callee cs))))
6                      (if (hash-table-get m:table callee #f
7                          (set! surface (+ 1 surface))
8                  )
9              )
10      )
11      (pdg-call-sites pdg)
12      )
13      surface
14      )
15  )
The function takes a PDG as its sole parameter, which is the internal data structure that represents a single function. This function first introduces a variable named surface (line 2), then loops over all call sites in the function (line 11) and for each one it finds the name of the called procedure (stored in the variable named callee on line 5). If that name is found in the table of input functions (line 6), then the value of surface is incremented (line 7). Once all call sites have been considered, the value of surface is returned (line 13).
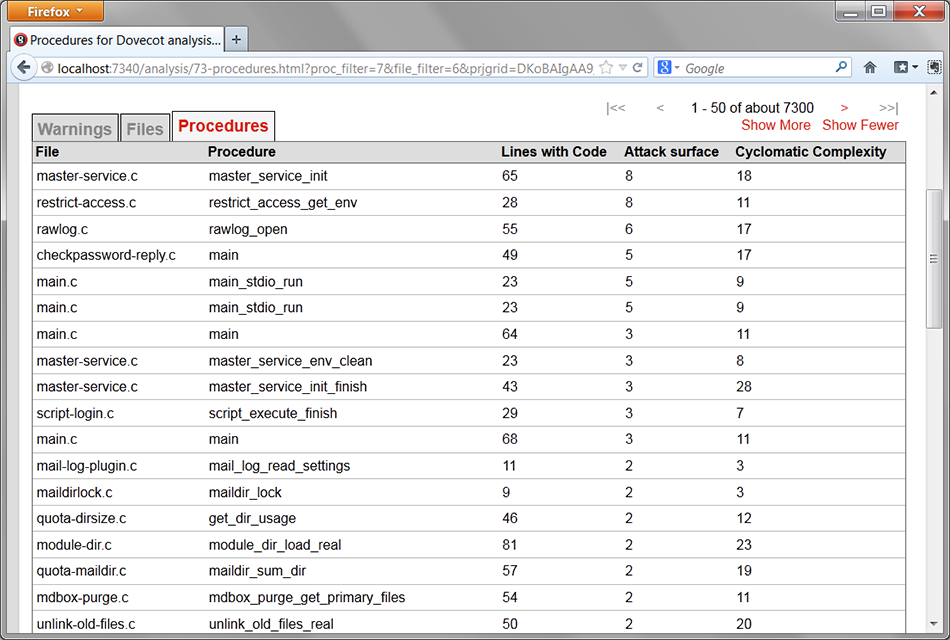
These functions go in a file, and once I tell CodeSonar to execute that file as a plug-in, those metrics show up completely automatically. Below is a screenshot that shows the value for some of the functions in the program.
A better way to show them is to construct a treemap that uses them. The screenshot below shows a treemap of the Dovecot program with the strength of the color indicating the value of the metric.
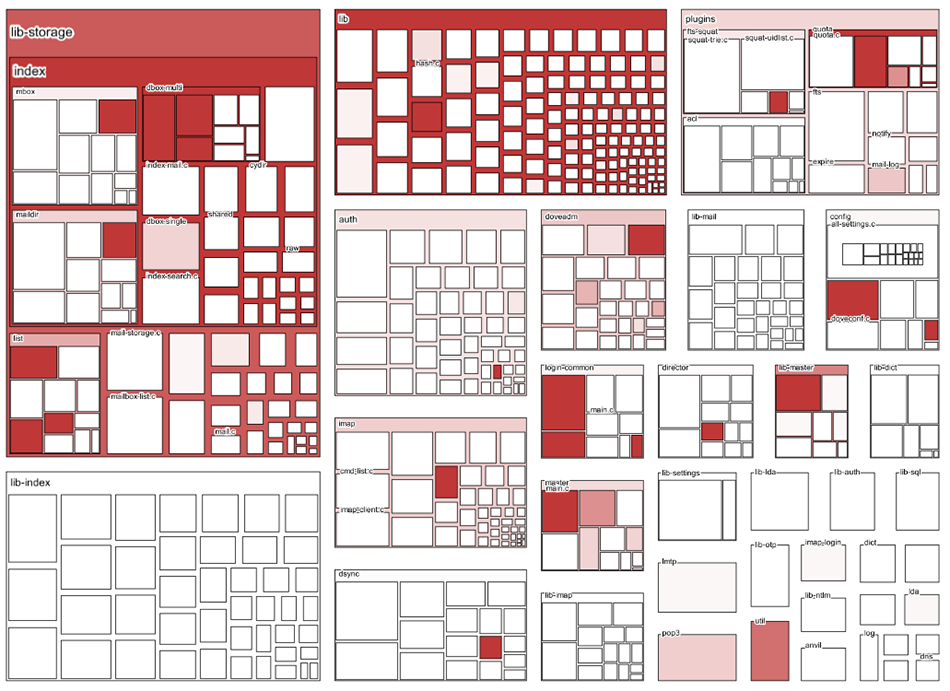
Just for fun, here’s one where the attack surface metric is used for the size, and the color indicates the number of lines of code. Note that if the metric is zero, then the node never shows up.

Now, my attack surface metric was extremely simplistic, and is unlikely to be everything that a genuine security analyst would really want. However, the above demonstrates how easy it is to extend CodeSonar to compute and display custom metrics. I hope this inspires others to use CodeSonar in a similar way.